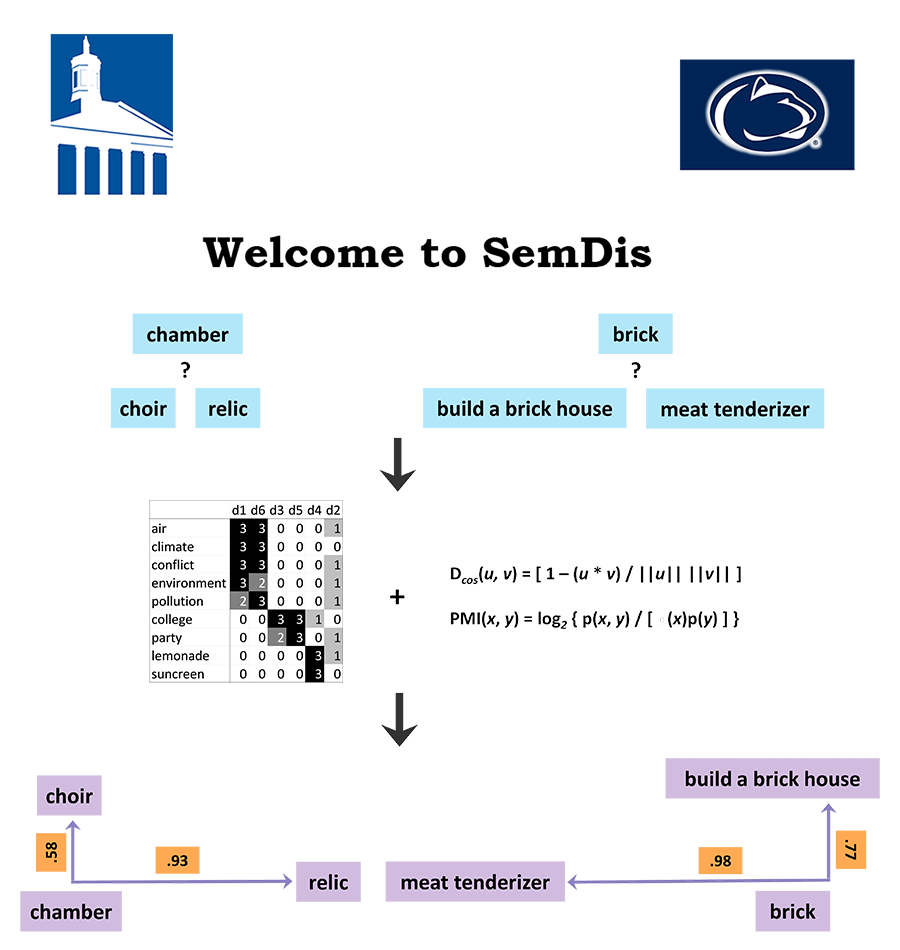
Developed by professors from Washington and Lee University and Penn State University, SemDis uses advances in natural language processing to automatically determine how closely associated texts are to each other. Higher SemDis scores indicate two texts are less related, that is, they are more distantly related ideas or concepts. For details see the Interpreting Semantic Distance tab.
SemDis is a powerful tool for exploring text. It is an avenue to explore new ideas with automated feedback on originality. These 4 apps are for anyone who wants to explore how related texts are. We hope educators, learners, researchers and other professionals will find it useful. To learn how to use the apps, see the Instructions for SemDis tab.
To cite this app, please cite the paper: Beaty, R. E. & Johnson, D. R. (2020) Automating creativity assessment with SemDis: An open platform for computing semantic distance. PsyArXiv. Click on the link below for access to the paper. Please report any SemDis issues in a detailed email to semdis_2416@outlook.com.
Generate Creative Uses for an Object
Choose semantic space
Choose an object
SemDis Graph
Instructions for SemDis
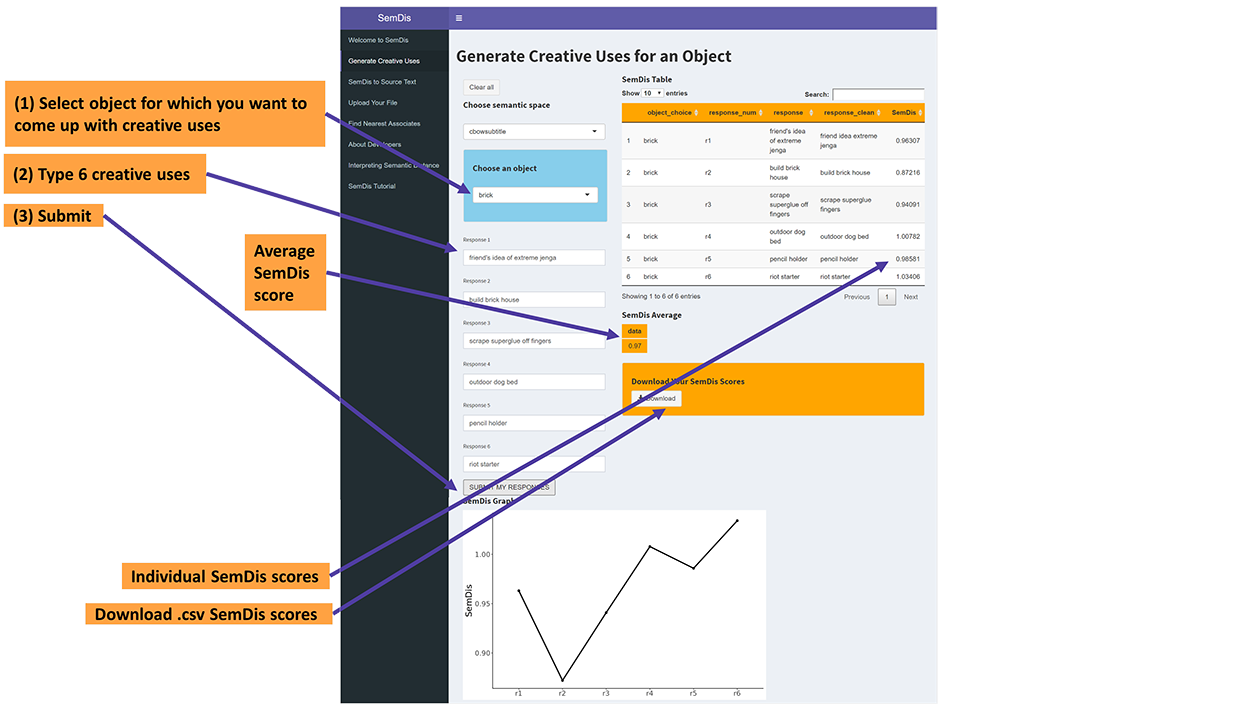
Generate Creative Uses
Explore your creativity by generating creative uses for common, everyday objects, like a brick. You can choose from a list of objects, and then type a few creative uses for the object. The app will then calculate SemDis scores that indicate how distantly associated, that is, how creatively linked your uses are to the object. Higher SemDis scores indicate higher creativity. You can choose which semantic space is used to derive your semantic distance scores. For more information on semantic spaces, see the Interpreting Semantic Distance section.
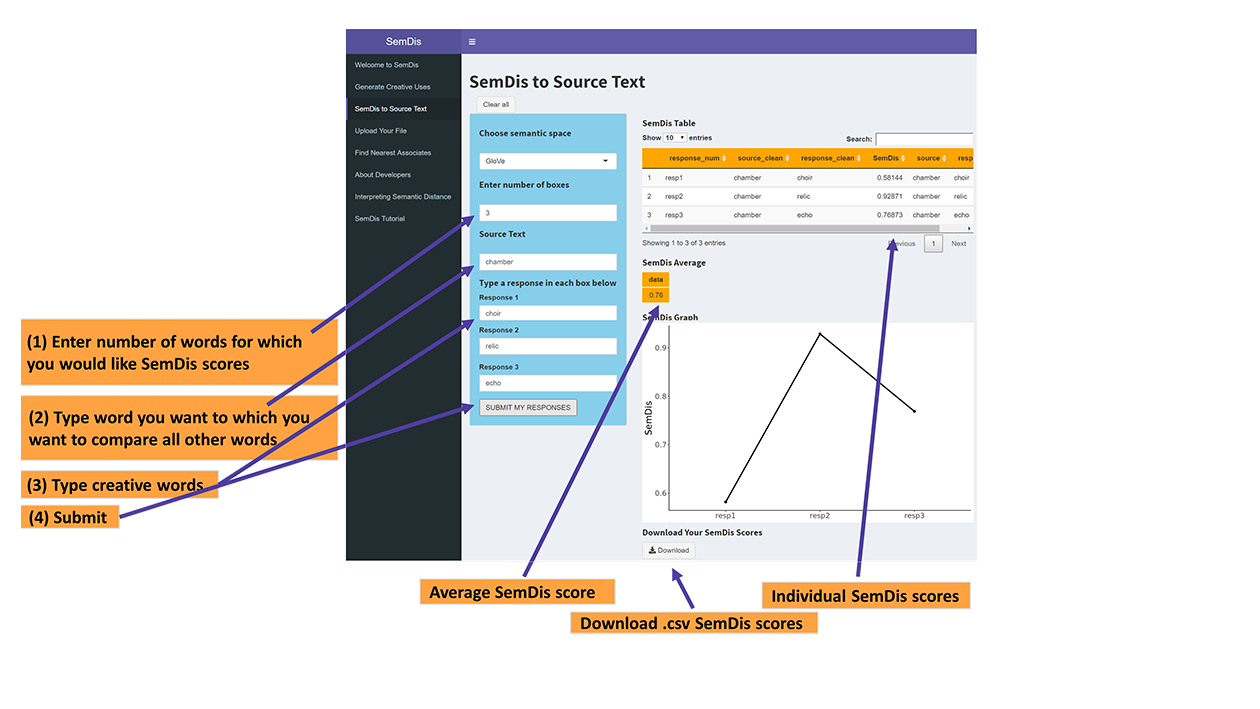
SemDis to Source Text
Get the association between a single text of interest and any number of additional texts. You can use this app to explore your creativity by coming up with words creatively linked to a source word. You simply type and/or copy and paste the text of interest in the Source Text box and then type and/or copy and paste which texts you want SemDis scores for in the boxes below. The app will give you the SemDis scores, that is, how distantly related each text is from the source text. Higher SemDis scores indicate more distantly related texts and higher creativity. You can choose which semantic space is used to derive your semantic distance scores. For more information on semantic spaces, see the Interpreting Semantic Distance section.
Upload Your File
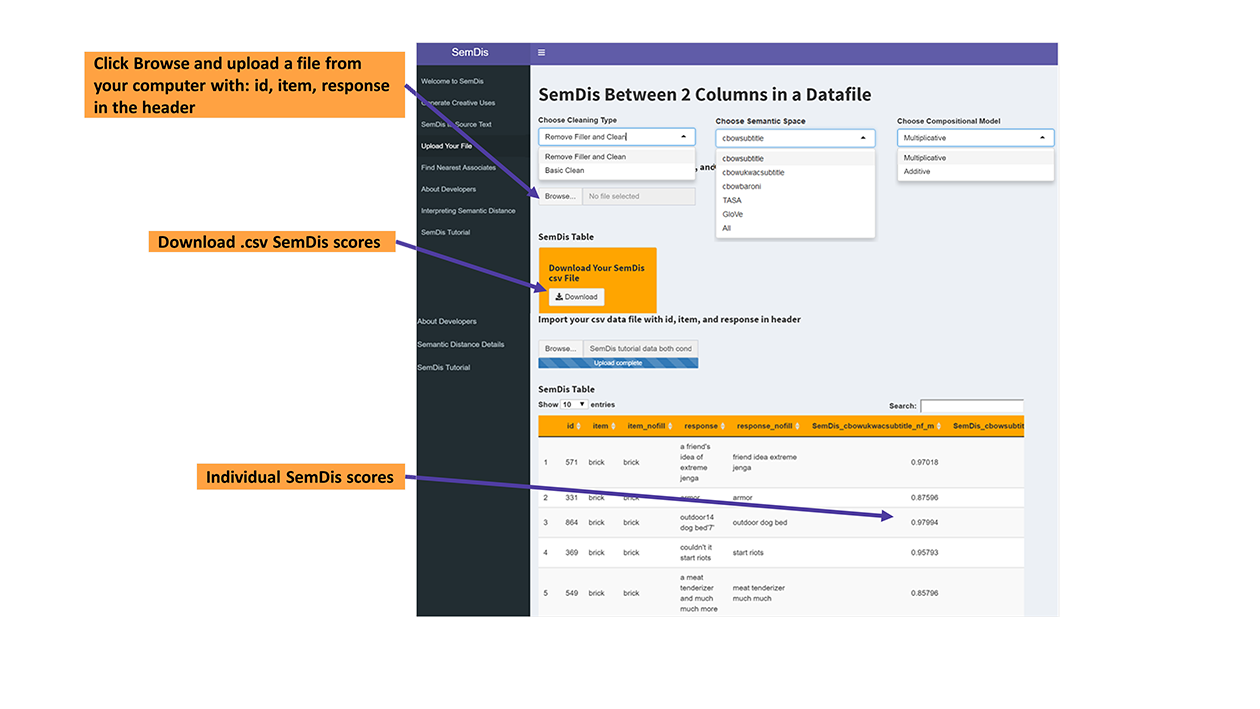
This app is mainly for researchers who have a datafile on which they would like to compute SemDis scores. This app provides flexibility in how SemDis scores are computed. You can choose how to clean your text data, including the removal of numbers, special characters, symbols, and filler words (e.g., a, the, and). For details see the SemDis Tutorial section.
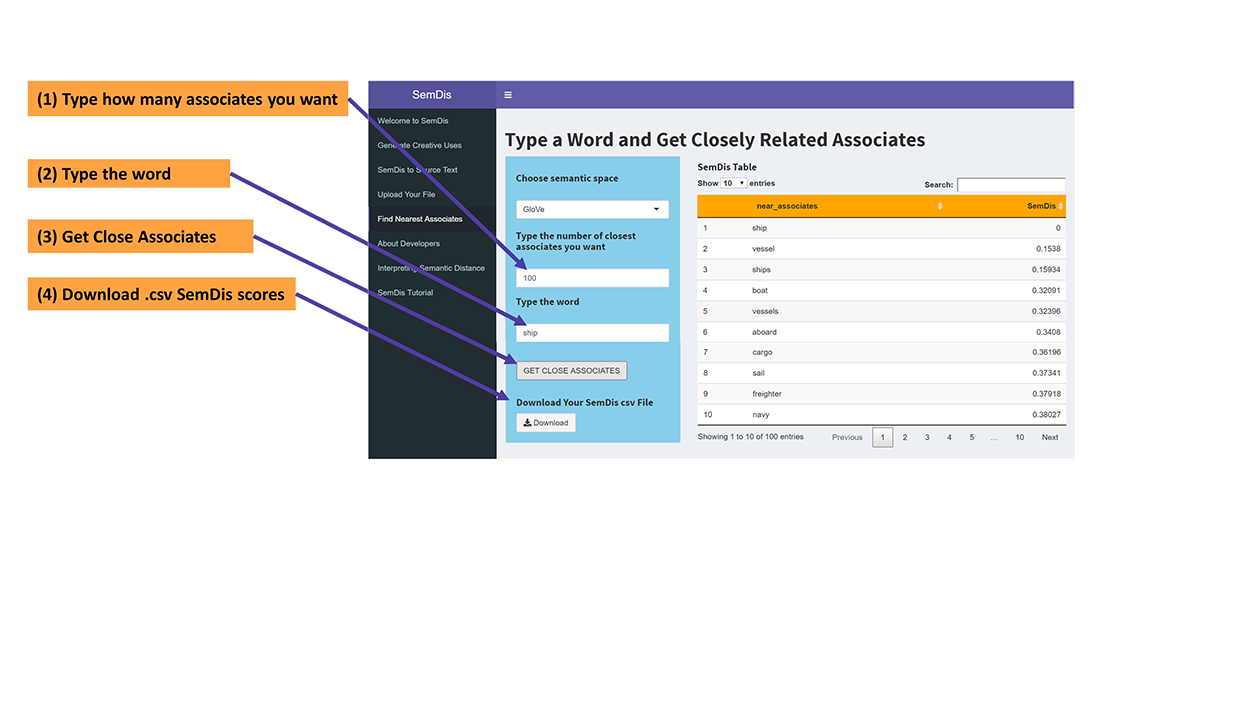
Find Nearest Associates
For this app you type a word of interest and get as many of the most closely related words as you would like from a high performing semantic space, that you also choose.
SemDis Between 2 Columns in a Datafile
Import your csv data file with id, item, and response in header
SemDis Table
Download Your SemDis csv File
Download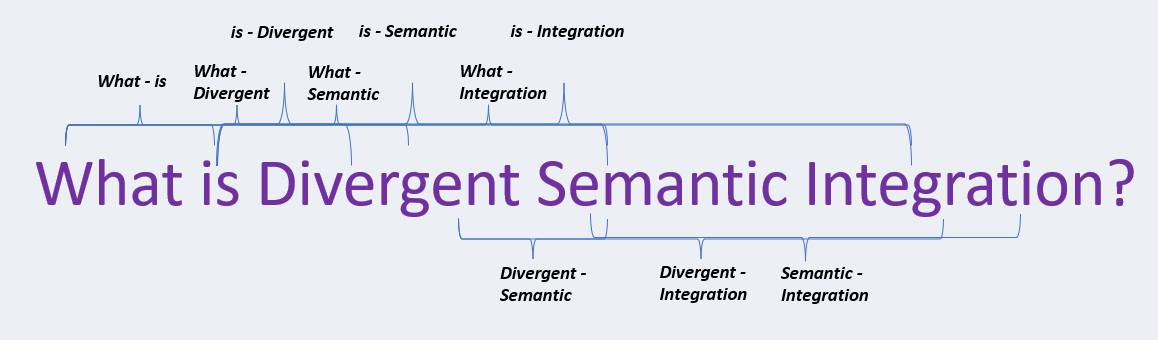
Divergent Semantic Integration (DSI) captures the extent to which a story connects divergent ideas. It is the mean semantic distance (SemDis) between all pairwise comparisons of words within a body of text. Higher scores indicate that the story connects more divergent ideas. DSI scores tend to range from .70 - .90, and 0 - 1 is the full range of DSI values.
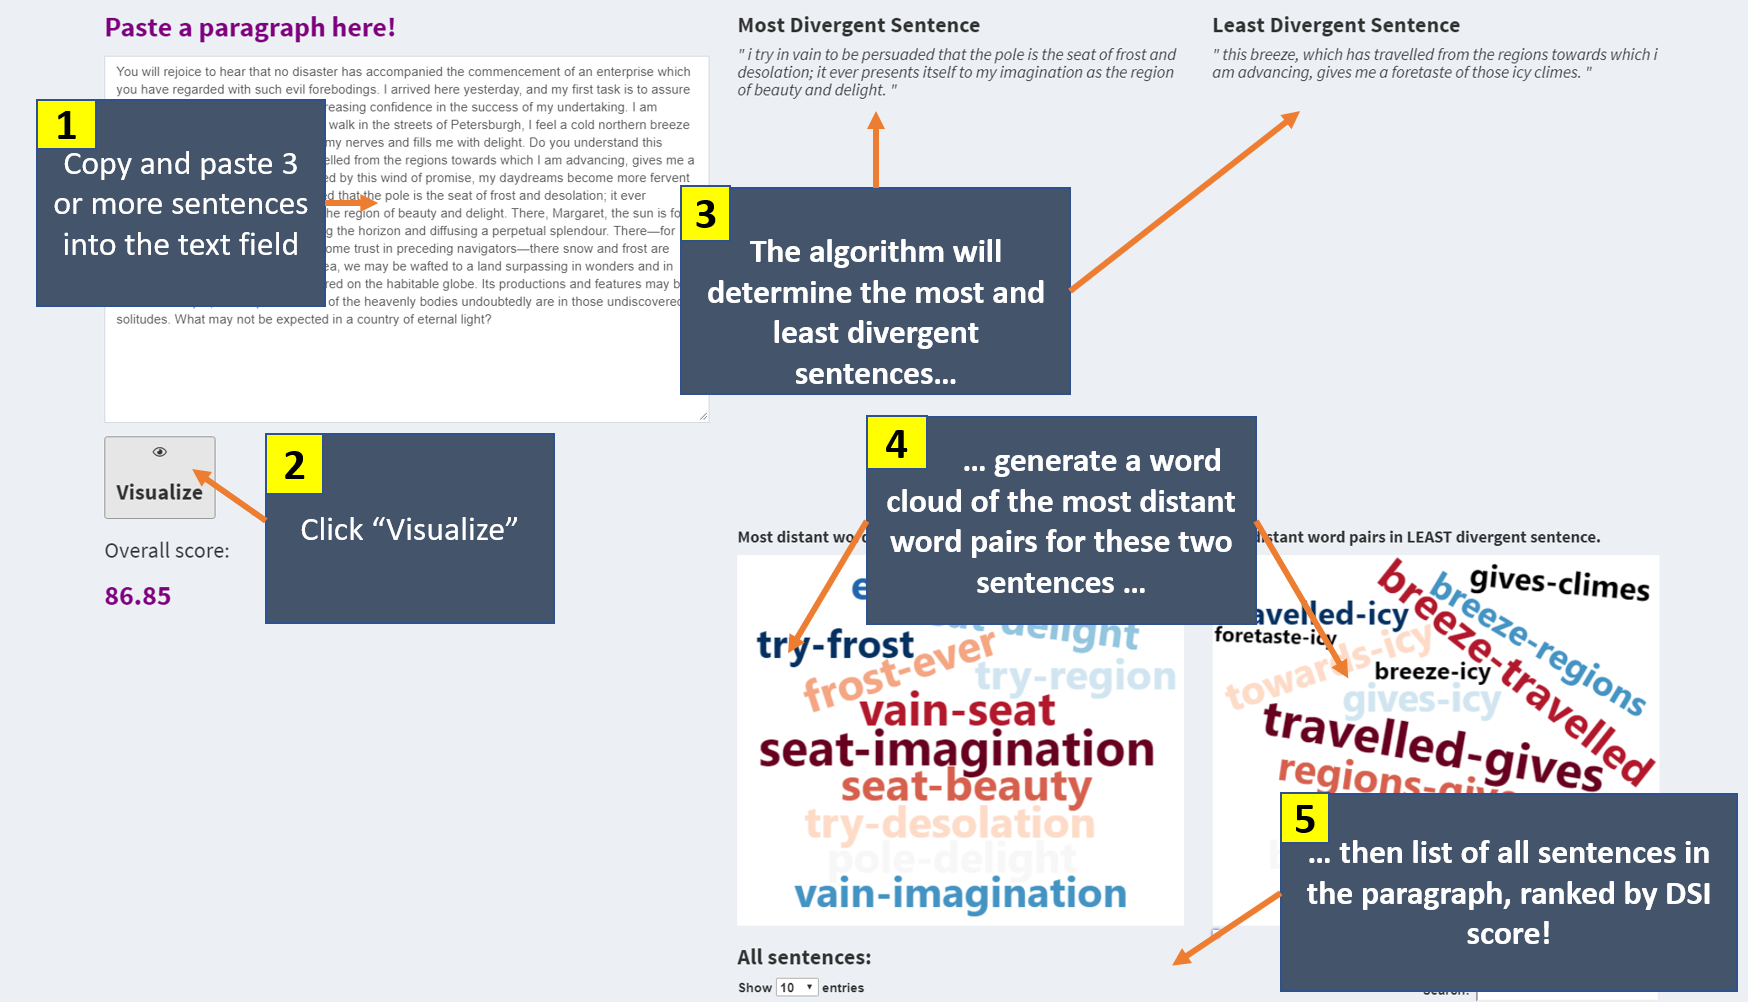
Visualizer
Paste a paragraph consisting of at least three sentences into the text field and click 'visualize.' The algorithm will calculate the most and least divergent sentences in the paragraph. Word clouds for these two sentences will also be generated, with the most distant word pairs being displayed. Bigger and redder words indicate greater distance! Finally, a list of all sentences will be generated, ranked from most to least semantically divergent.
Upload your file app:
1.
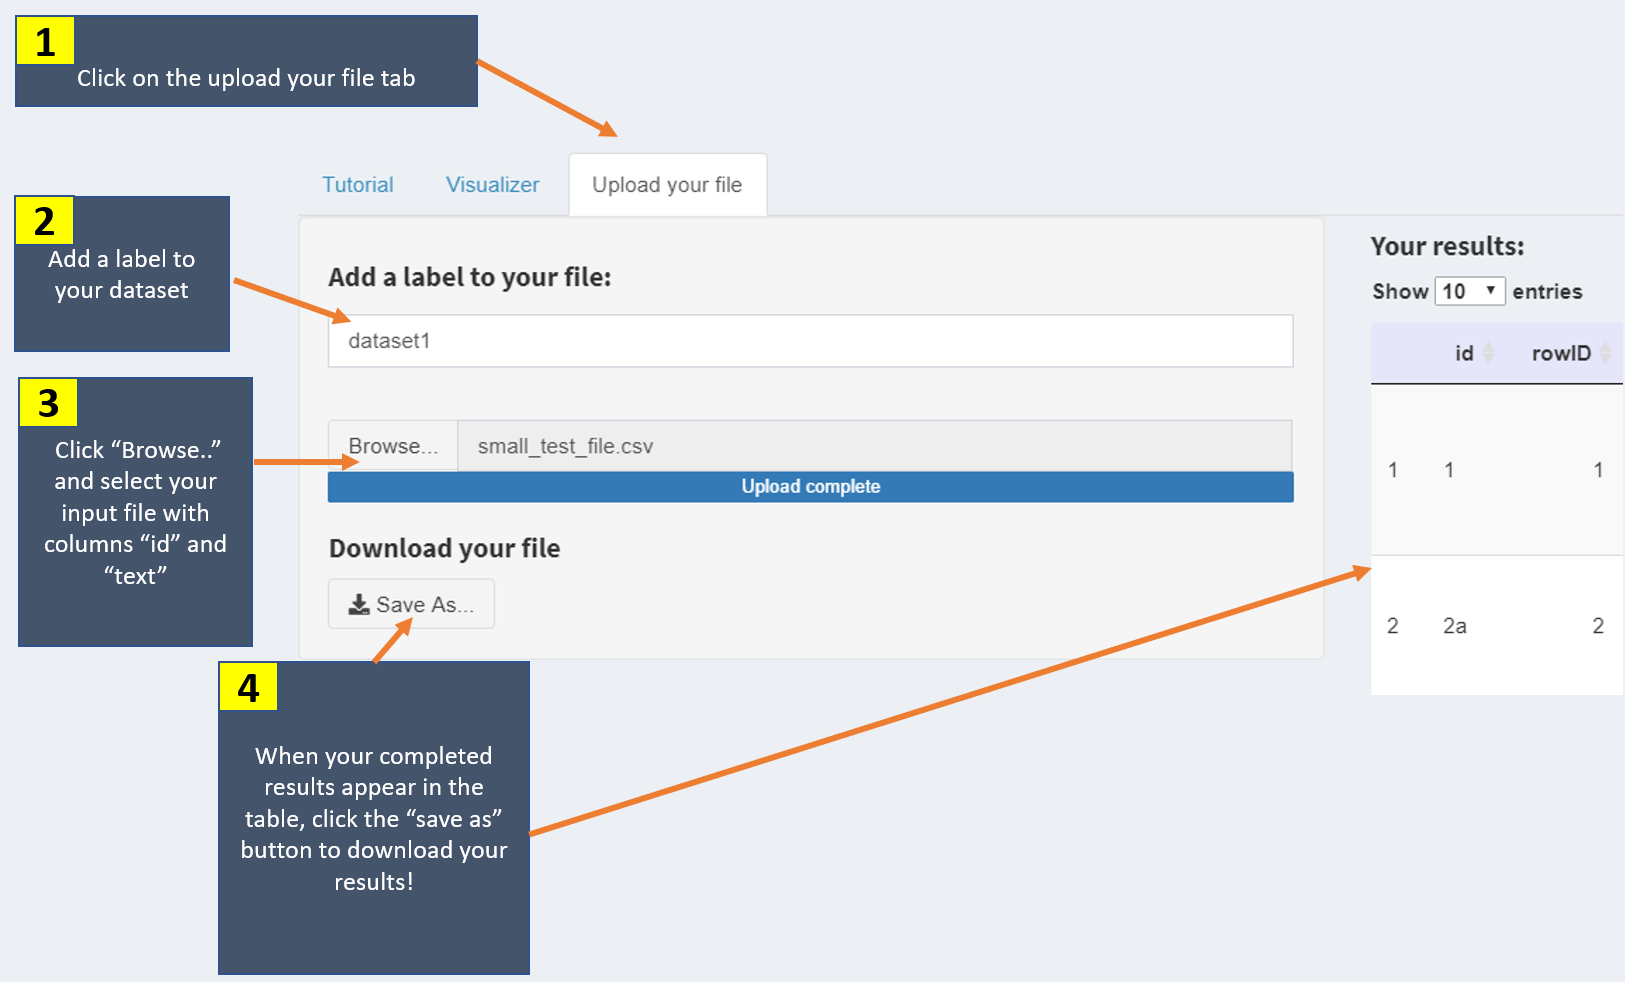
Click on the 'upload your file' tab above.
2.
Type a label for your dataset. This label will be appended to your download filename.
3.
Upload a csv file with two columns named 'id' and 'text'. The column names are case sensitive.
The id column may be any unique identifier for each row. The app will calculate DSI scores for each cell in the text column.
4.
When the progress bar completes and you can see results in the table, click the 'Save as...' button to save a csv file of your results to your computer.
Word Embedding Approach
The DSI visualizer uses the cbowsubtitle semantic space, which is a continuous bag of words (CBOW) model built on the subtitle corpus. The 'Upload your file' app will generate a DSI value for all five semantic spaces available on this website, as well as the mean value. For more information on how to interpret each space, please see the 'Interpreting Semantic Distance' tab on the left.
Type a Word and Get Closely Related Associates
SemDis Table
About Developers
Dan Johnson
A professor and researcher at Washington and Lee University, Dr. Johnson's primary role was to use the Shiny R platform to develop this interactive website using the state of art in computational models of text associations. Please report any issues with SemDis in a detailed email to semdis_2416@outlook.com. For more see:
Roger Beaty
A professor and researcher at Penn State University, Dr. Beaty's primary role was to apply psychometric modeling to establishing the validity of using semantic distance as a way to automatically assess creativity. For more see:
Interpreting Semantic Distance and References
How to interpet SemDis scores?
Semantic distance captures how distantly related ideas, concepts, or other texts are. It is based on the idea that words that occur in similar contexts are similar in meaning (Gunther, Rinaldi, Marelli, 2019). For example, the word chamber and choir often occur in similar contexts so there would be low semantic distance between them. But, the word chamber and relic do not often occur in the same contexts, so there would be high semantic distance between them. If you put in phrases into the Generate Creative Uses or SemDis to Source Text app, a multiplicative compositional model will combine each word vector into a single, best performing vector. For the validity of this approach, see our validity paper (Beaty & Johnson, 2020) and Mitchell & Lapata (2010). The Upload Your File app provides flexibility in model selection. You get SemDis scores from 5 different semantic spaces and you can choose whether to employ an additive or multiplicative compositional model if you're using phrases. Below we will detail how these models are built, why we chose the following 5 models, and explain how to interpret semantic distance scores.
Comparing two words
Semantic distance scores range from 0 to 1 in all semantic models, where higher scores indicate the two words are more distantly related. Scores coming from the same semantic model can be compared across datasets and conditions. However, scores from two different models cannot be compared (e.g., cbowukwacsubtitle cannot be compared to TASA). In addition, factor scores can only be compared within the same dataset when all observations are run through SemDis simultaneously. So, you cannot run a control condition from one dataset and then an experimental condition from another dataset and compare factor scores, as they are computed relative to all scores currently run in a dataset.
Comparing word to phrase or phrase to phrase
Semantic distance scores range from 0 to 2 in all semantic models, where higher scores indicate the two texts are more distantly related. Scores coming from the same semantic model can be compared across datasets and conditions. However, scores from two different models cannot be compared (e.g., cbowukwacsubtitle cannot be compared to TASA). In addition, factor scores can only be compared within the same dataset when all observations are run through SemDis simultaneously. So, you cannot run a control condition from one dataset and then an experimental condition from another dataset and compare factor scores, as they are computed relative to all scores currently run in a dataset.
cbowukwacsubtitle and cbowsubtitle
These two semantic spaces were built using a neural network architecture, which uses a sliding window to move through the text corpora and tries to predict a central word from its surrounding context, similar to algorithms first developed in word2vec (Mikilov et al., 2013). So, typically the more often a context of words co-occurs with a target word, the more closely they are semantically related. Put another way, words that share similar contexts, also share meaning. These models are built on this assumption. These two continuous bag of words models (CBOW) have previously demonstrated robust associations with human judgments of relatedness, lexical decision speed, and free associations (Mandera et al., 2017). The first CBOW model is built on a concatenation of the ukwac web crawling corpus (~ 2 billion words) and the subtitle corpus (~385 million words). The second CBOW model was built on the subtitle corpus only. Each semantic space consisted of context window size of 12 words (6 to the left and 6 to the right of the target word), 300 dimensions, and the most frequent 150,000 words (for more details see Mandera et al., 2017).
cbowBNCwikiukwac and GLoVe
The third semantic space was also built using CBOW but on a concatenation of the British National Corpus (~2 billion words), ukwac corpus, and the 2009 Wikipedia dump (~ 800 million tokens) using a context window size of 11 words, 400 dimensions, and the most frequent 300,000 words. This space also shows robust associations with human judgements of relatedness and was the best performing model compared to multiple CBOW and Latent Semantic Analysis, that is, LSA-based count models (Baroni et al., 2014). The fourth space was built using a count model but in contrast to LSA, it capitalizes on global information across the text using weighted least squares, called global vectors (GloVe, Pennington et al., 2014). It was built on a concatenation of a 2014 Wikipedia dump and the Gigaword corpus, which contains numerous news publications from 2009-2010). It was trained on ~6 billion tokens, with a final dimensionality of 300 and the top 400,000 words. It has shown robust associations with human judgments of relatedness, comparable to CBOW models (Pennington et al., 2014).
TASA
The fifth semantic space has the longest history and was built using LSA, called TASA, downloaded from Gunther et al.'s (2015) website, also used on the lsacolorado.com interactive website. Termed a count model, it was built by computing the co-occurrence of words and documents. The primary assumption is that if words frequently co-occur in the same types of documents, they have similar meaning. After forming this co-occurrence matrix between words and documents, a singular value decomposition is performed on that sparse matrix to reduce the dimensionality. The corpus contained over 37,000 documents, 92,393 different words, and was reduced to 300 dimensions. Primary text sources were middle and high school textbooks and literary works. This space demonstrated its validity in its application to a creative word association task (Prabhakaran et al., 2014).
Compositional Model
The two models SemDis provides are additive and multiplicative. These two models will only be different if your text includes more than one word. The additive compositional model simply sums up all word vectors of a phrase into a single vector and often correlates well with human ratings of relatedness (Mitchell & Lapata, 2010). But, the multiplicative compositional model outperforms the additive model and other more complex models in its correlation with human ratings of relatedness and creativity (Beaty & Johnson, 2020; Mitchell & Lapata, 2010). The multiplicative model takes the product of all words vectors to create a single vector for a phrase. This allows the shared semantic dimensions of the component words to receive higher values in the final vector and semantic dimensions that are not shared between words to receive lower values. Put another way, words with similar meaning get a bump in the final vector and words with different meaning get a reduction.
References
Below see annotated references that support the validity of SemDis as a tool to automatically compute text relatedness.
Beaty, R., & Johnson, D. R. (2020). Automating creativity assessment with SemDis: An open platform for computing semantic distance. PsyArXiv. This is the primary paper supporting the validity of the application of SemDis to automated creativity assessment, co-authored by the developers. See link below to the paper.
Baroni, M., Dinu, G., & Kruszewski, G. (2014). Don't count predict! A systematic comparison of context-counting vs. context-predicting semantic vectors. Proceedings of the 52nd Annual Meeting of the Association for Computational Linguistics, 238-247. This compares multiple models and shows robust relationship between semantic distance and human ratings of relatedness.
Forthmann, B., Oyebade, O., Ojo, A., Gunther, F., & Holling, H. (2018). Application of latent semantic analysis to divergent thinking is biased by elaboration. Journal of Creative Behavior. This article shows how removing stop words from alternate use task responses improves the correlation between semantic distance and human ratings of creativity.
Gunther, F., Dudschig, C., & Kaup, B. (2015). LSAfun - an R package for computations based on latent semantic analysis. Behavior Research Methods, 47, 930-944. Provides functions and computations to perform LSA in R. A special thanks to Fritz Gunther for answering a question about how to modify his functions to produce different compositional models than his R package would allow.
Gunther, F., Rinaldi, L., & Marelli, M. (2019). Vector-space models of semantic representation from a cognitive perspective: A discussion of common misconceptions. Perspectives on Psychological Science, 14, 1006-1033. Excellent review of theoretical background for distributional semantic models and recent applications.
Hass, R.W. (2017). Tracking the dynamics of divergent thinking via semantic distance: Analytic methods and theoretical implications. Memory & Cognition, 45, 233-244. Excellent early work demonstrating the viability of using semantic distance to examine divergent thinking.
Heinen, D.J.P., & Johnson, D.R. (2018). Semantic distance: An automated measure of creativity that is novel and appropriate. Psychology of Aesthetics, Creativity, and the Arts, 12, 144-156. Shows validity of using semantic distance as a measure of creativity in a word association task with correlations between human ratings of creativity, novelty, and appropriateness.
Johnson, D.R., Cuthbert, A.S., & Tynan, M.E. (2019). The neglect of idea diversity in creative idea generation and evaulation. Psychology of Aesthetics, Creativity, and the Arts. Shows validity of using semantic distance as a measure of creativity in a word association task with correlations between human ratings of creativity and idea diversity.
Mandera, P., Keuleers, E., & Brysbaert, M. (2017). Explaining human performance in psycholinguistic tasks with models of semantic similarity based on prediction and counting: A review and empirical validation. Journal of Memory and Lanuage, 92, 57-78. Most comprehensive comparison of various computational frameworks showing semantic distance's robust ability to predict human performance on lexical decision tasks, naming tasks, free association tasks, and relatedness judgments. Also shows predict models (e.g., CBOW) are more robust to changes in parameters (e.g., window size) than count models, but when tuned properly, count and predict models have comparable predictive power.
Mikolov, T., Yih, W., & Zweig, G. (2013). Linguistic regularities in continuous space word representations. Proceedings of NACCL-HLT, 746-751. Creates one of the first neural network-based computational models of natural language processing and outperforms LSA-based models in predicting human ratings of similarity. All 3 CBOW models used in SemDis are based on this framework and is among the best performing models.
Mitchell, J., & Lapata, M. (2010). Composition in distributional models of semantics. Cognitive Science, 34, 1388-1429. Tests how well various models of combining word vectors into a single vector relate to human judgments of relatedness. Demonstrates a multiplicative model performs best in comparison to an additive model and more complex models.
Pennington, J., Socher, R., & Manning, C.D. (2014). GloVe: Global vectors for word representation. Shows that a count model, similar to LSA, can perform as well as a predict model (e.g., CBOW), when using a novel weighted least squared computational framework.
Prabhakaran, R., Green, A.E., & Gray, J.R. (2014). Thin slices of creativity: Using single-word utterances to assess creative cognition. Behavior Research Methods, 46, 641-659. This is one of the first articles to show that semantic distance responds to manipulations of creativity and shows correlations with other popular creativity tasks (e.g., the alternate uses task).
Tutorial for the Upload Your File app
In this section we'll show you how to upload a few data files we've provided on our OSF website.
Structure of the data file you'll upload
The first dataset we'll upload is called SemDis tutorial data for both conditions.csv . You can download this at the link above from a folder called SemDis Tutorial. The data file must have a .csv extension. The first 3 variables in this data file are required for the app to work and must have the following names that are case sensitive: id , item , response . You may include as many variables as you wish and they will be included in your download with SemDis scores appended as the last of the columns. The fourth variable in this data file refers to a randomly assigned condition to which subjects were assigned, called, condition. Subjects were assigned to give either creative or common uses for item. id refers to a variable that uniquely identifies each response. This could be a subject identifier if each subject only have one response. However, it is more likely subjects gave more than one response, so the id column but be something else. It is recommended, but not required by the app, that there is a unique id for each response. The item and response columns refer to the pair of text for which you want SemDis scores. SemDis will give the semantic distance between the item and response columns. So, for the first row in this data file, it will semantic distance between (brick) and (a friend's idea of extreme jenga). As you can see in the picture of the SemDis tutorial data for both conditions.csv data must be in long format, so that all responses are in one column, instead of spread out across multiple columns. The first row must contain the variable names.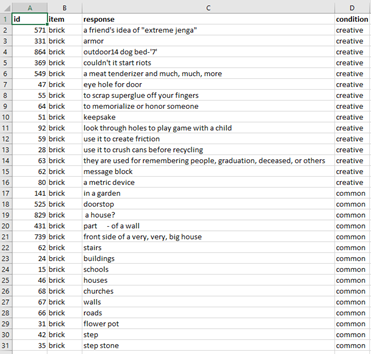
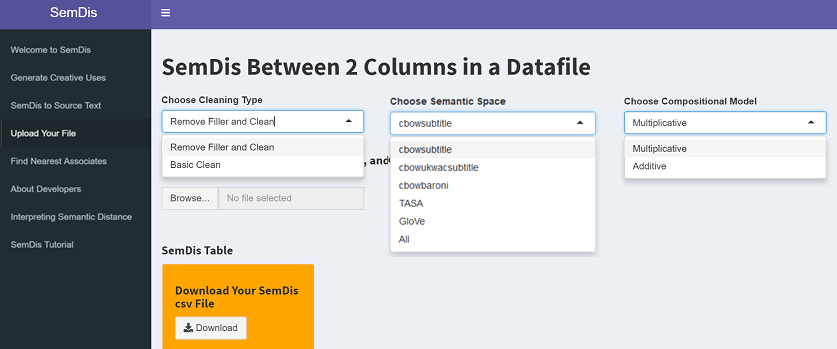
Options for data cleaning and semantic model
There are 3 main selection boxes. The Choose Cleaning Type allows you to either remove special characters and numbers (Basic Clean) or do this and also remove filler or stop words (Remove Filler and Clean). Example filler words that will be removed include a, the, is, and, also. The Choose Semantic Space allows you to select from the five high performing semantic spaces that typically demonstrate strong correlations with human ratings of relatedness or all 5 semantic spaces described in the Interpreting Semantic section of the app (called All). The Choose Compositional Model is only relevant if your text includes more than one word. The Multiplicative model combines word vectors by taking the product of all word vectors and research suggests this approach aligns best with human ratings of relatedness and creativity (see Beaty & Johnson, 2020; Mitchell & Lapata, 2010). The Additive model simply sums the word vectors and often performs adequately.
Uploading and Downloading your data file
Ensure you have the appropriate structure required for your .csv file (see above section). Then, you simply click Browse and navigate to your file on your computer. Once you click on your data file, SemDis computations will begin. You will see a progress bar in the bottom right hand portion of the screen. Some of these semantic spaces are quite large, so it could take many minutes for a large dataset to finish (e.g., on a standard PC laptop, a 500 observation dataset took 3 minutes to give SemDis scores for all semantic spaces, and a 4,000 observation dataset took 15 minutes). When the download is complete, a summary table will appear in the app that is searchable and can be sorted by different columns. Then you can click the Download button and download your SemDis scores in .csv format.
Let's practice with the SemDis tutorial data for both conditions.csv data file. Get it from our OSF link at the top of the page.Set the 3 selection boxes to following
Choose Cleaning Type: Remove Filler and Clean
Choose Semantic Space: All
Choose Compositional Space: Multiplicative
Go ahead and upload the SemDis tutorial data for both conditions.csv data file. It should look like this after the upload. Because you selected All semantic spaces, you will get SemDis scores for each space, where the space is listed after SemDis_ and the ending suffix indicates you removed filler words (_nf) and selected the multiplicative (_m). If you scroll all the way to right, you will the last SemDis scores are SemDis_factor scores. These are factor scores from a confirmatory factor analysis. Please see how to interpret these in the next section. Here is what it should look like when complete.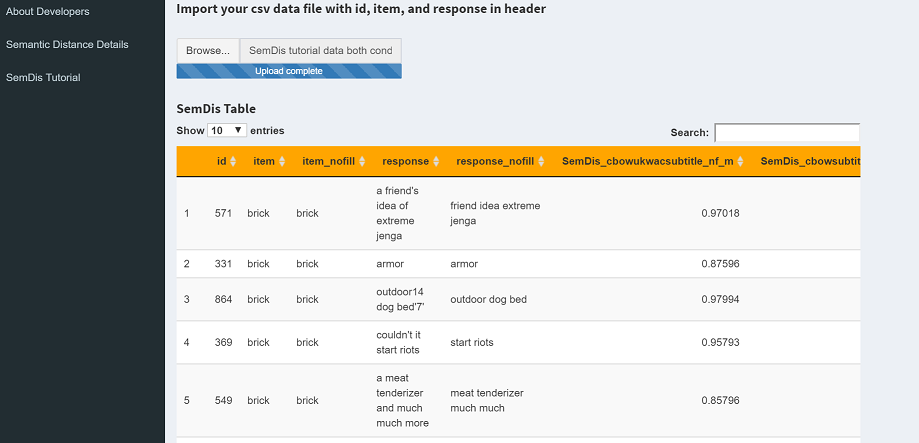
Interpreting your SemDis factor scores or SemDis_MEAN
Semantic distance scores range from 0 to 2 in all semantic models, where higher scores indicate the two texts are more distantly related. Scores coming from the same semantic model can be compared across datasets and conditions. However, scores from two different models cannot be compared (e.g., cbowsubtitle cannot be compared to TASA). For more details on each semantic model see the Semantic Distance Details section. A mean of SemDis scores across all 5 semantic spaces is provided called, SemDis_MEAN. In addition, factor scores (the final score labeled, SemDis_factor) will generally range from -1 to 1 and can only be compared within the same dataset when all observations are run through SemDis simultaneously. So, you cannot run a control condition from one dataset and then an experimental condition from another dataset and compare factor scores, as they are computed relative to all scores currently run in a dataset. In addition, phrases with more words in them will tend to produce higher SemDis scores when compared to a single word or other phrases. So, compare single word to phrase vs. single word to single word associations with caution, as longer phrases may produce higher scores even if an idea is not more creative. When used out of the context creativity, you will want longer phrases to have higher SemDis scores compared to other longer phrases because it will less likely the phrases have similar meanings throughout.
If you want to capture the rich information offered by all 5 semantic spaces, you can use either the mean SemDis score across the 5 spaces, termed, SemDis_MEAN or you can use SemDis_factor scores. The primary advantage to using these composite scores is that they are robust to idiosyncratic differences between each semantic model, so the scores should be more generalizable across text applications. However, both should be used with caution as they each have inherent limitations. The main limitations of SemDis_factor scores is that the factor model may not converge producing inaccurate estimates, require more observations for higher reliability (minimum, n = 50), all scores are computed relative to other scores in the dataset, and the range of scores vary based on sample size and other factors making the scores difficult to interpret. In contrast, SemDis_MEAN scores are independent of sample size and any other sample characteristic (e.g., variance), the scores are absolute in that they are not computed relative to other scores, and the scale is easier to interpret as they are the same across nearly any data set (always 0 - 2). The main limitation of SemDis_MEAN scores is that each semantic space can produce higher or lower scores and / or variance. The consequence is that a single semantic space could dominate the SemDis_MEAN score because it has higher variability or higher values generally. Generally, we have not found a substantial bias due to a single semantic space in SemDis_MEAN scores, but it should be used with caution. In addition, if the absolute value SemDis_factor scores are much greater than 1, then the confirmatory factor analysis model did not likely converge. In this case, do not interpret the factor scores and instead use the SemDis_MEAN composite or a single semantic space score like cbowsubtitle or glove.
Let's compare scores when we upload both the common and creative conditions simultaneously (in the SemDis tutorial data both conditions.csv file ) vs. uploading each condition in separate data files. Above we uploaded the both conditions data file and found the following SemDis scores for id 331 and id 141.id = 331
SemDis_cbowukwacsubtitle_nf_m model = 0.87596
SemDis_glove_nf_m = 0.85619
SemDis_factor score = 0.0041
SemDis_MEAN = 0.92306
id = 141
SemDis_cbowukwacsubtitle_nf_m model = 0.76529
SemDis_glove_nf_m = 0.65213
SemDis_factor score = -0.08613
SemDis_MEAN = 0.80295
It would be correct to say that that the response from id 331 was more creative than id 141 because SemDis_cbowukwacsubtitle_nf_m model = 0.87596 is greater than SemDis_cbowukwacsubtitle_nf_m model = 0.76529 because this compares SemDis scores from the same models. It would also be correct to say the response from id 331 is more creative than id 141 because SemDis_MEAN = .92306 vs. 0.80295. It would be incorrect to say id 331 is more creative than id 141 because SemDis_cbowukwacsubtitle_nf_m model = 0.87596 is greater than SemDis_glove_nf_m = 0.65213 because this compares across two different models. It would also be correct to say id 331 is more creative than id 141 because SemDis_factor score = 0.0041 is greater than SemDis_factor score = -0.08613 because you ran both the common and creative condition simultaneously. So, even the id 331 is from the creative condition and id 141 is from the common condition, because you ran them simultaneously, you can use factor scores to compare them. Let's contrast this to the next example where we upload the common and creative condition in separate data files.
Upload the SemDis tutorial data creative only.csv data file. You can get this from our OSF link at the top of the page. You will get this from id 331. Note how everything is the same as when you imported the both conditions date file except the SemDis_factor score, which changed to -0.05381 from 0.0041. This is because factor scores are computed relative to all other observations in the dataset. So it based on a relative comparison between the 14 other observations in this condition. In contrast, when you uploaded the both condition data file, the factor scores were based on all 30 observations in the full dataset.
id = 331
SemDis_cbowukwacsubtitle_nf_m model = 0.87596
SemDis_glove_nf_m = 0.85619
SemDis_factor score = -0.05831
SemDis_MEAN = 0.92306
Troubleshooting and File Size Limits
First, check to be sure you have an id, item, and response column. This is required.
If you get the following error message, where the number matches the number of rows in your datafile (e.g, 535), then there is likely something wrong with your header that is case sensitive and must have id, item, and response.
We tested SemDis file size limits in a few ways. Using actual creativity data from the alternate uses task, we tested how many responses SemDis could be read with a single prompt in the item column (e.g., rope). Using the Remove Filler and Clean, All semantic models, and Multiplicative settings in the Upload Your File app, we found SemDis could handle 10,000, 20,000, 30,000, and 40,000 responses, which took 45 min, 72 min, 107 min, and 140 min, respectively to generate a file for download. It is likely SemDis could read in more than 40,000 responses, but 40,000 was highest number we tested as this exceeds the number of responses in typical creativity research data sets.
We tested the upper limit of the number of words in multi-word responses SemDis could read. Using the Remove Filler and Clean, All semantic models, and Multiplicative settings in the Upload Your File app, we found the upper limit for the length of phrases to be greater than 1,000 and less than 2,000 words, where the number of responses (i.e., rows) was not the limiting factor.
It is important to note that all the above limits were based on current server configurations. We hope to increase processing speed and stability as the demand for SemDis increases. Consequently, the limits and timing may change over time. If other issues are discovered, we welcome detailed feedback at semdis_2416@outlook.com.
Advanced Users
Users interested in generating SemDis factor scores from a different model may do so by selecting All from the Choose Semantic Space menu. Semantic distance values from all 5 semantic models will be output. Using your preferred software (e.g., Mplus, R), you can then use a different factor score model (e.g., Bartlett's, Maximum Likelihood) from the default method used in SemDis (i.e., Empirical Bayes Model).